My First Encounter with Xangati for ESX

Xangati for ESX (Free Edition) is always ranked as one of the top 10 Free ESX Appliances. I finally got time to test it although not very successful, the following is my findings.
- Xangati called its product a management tool for ESX, in fact, it is really a packet sniffer built on Linux CentOS like Wireshark or Ethereal and on top it combines the ESX monitoring capability like Veeam Monitor or Vizioncore’s vfoglight.
- Documentation for Xangati for ESX (Free Edition) is too simple, although you will find two video on Youtube that showing how to setup Xangati, but there is FAQ or community help (There is a community, but it’s really an one way Xangati board)
- Importing OVF into ESX is straight forward, but after starting up the VM, I encountered a problem that the screen showing blank with only X cursor moving, hence, I have no way to open GUI and continue to installation. There was a error in VM event showing my video ram is not big enough, so I’ve increased it to 16MB and the problem continues, quitting the session, I found VM console was showing some kind of JAVA error, I guess there is something wrong with JAVA that prevents the GUI (or JAVA) console to be shown. Finally, I’ve also tried to re-deploy the OVF as thick as thin format may cause the reason, but it still showing blank screen anyway
- After google a bit, again I was lucky to find a PDF that showing a bit more details for the installation, although it’s for Xangati Dashboard, within I was able to locate the username “setupip”, but where is the password? So I used the same username as password, ok, I got in and successfully configured my Network, DNS, Time Zone, etc. Btw, I’ve sent an email to support@xangati.com regarding the blank screen originally, but still got no reply after 24 hours.
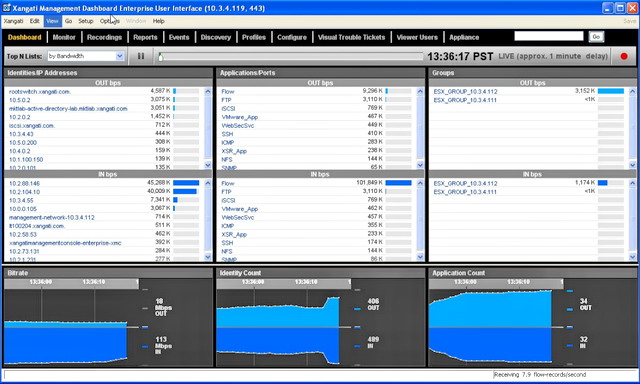
- After connected to the configured Xangati appliance via browser and login as admin, I was able to pull some traffic across my internal ESX host and management IP range. Then I figured out the Free Version can only support 10 IP devices and most importantly, it doesn’t support vCenter, but only 1 ESX Host although I’ve already configured my vCenter IP and tested the connection is valid (no warning in that step), so I’ve changed the vCenter IP to a ESX Host IP and removed all the discovered devices and let the appliance run for 5 minutes, later it just show the traffic for the ESX host and not the VM within, so what’s the point after all?
- The biggest draw back is there is no where mentioning in that 4 page quick installation guide which network portgroup should we connect Xangati VM to. To my instinct, I just use the Service Console portgroup network segment, as it’s where most these kind of monitoring tools works, like Veeam Monitor and Vizoncore vfoglight. However, why there is no VM showing up? I don’t know.
- Veeam Monitor and Vizoncore vfoglight are not appliance based, but application based software instead but they can also provide almost exactly the same feature for showing exactly what’s going on each ESX Host as well as individual VM. Yes, they do not provide any insight into traffic pattern, such as how much WWW is going though at the moment, as well as Email traffic etc. However since I am using PRTG’s packet monitoring that can directly connect into the external switch’s mirror port and monitor all the incoming/outgoing traffic from there, so I don’t really need this feature with Xangati. Last time, this great feature allows me to quickly identify a server IP that’s sending 100Mbps outgoing DDOS via UDP protocol using an encrypted PHP script, which was uploaded by hacker to a client’s web site through it’s ASP upload security hole.
- Finally, the UI of Xangati is not eye catching and easy to use as the Veeam Monitor or Vizoncore vfoglight, combining with installation and the rest, I think it’s potentially a great product, but still has a long way to catch up.


